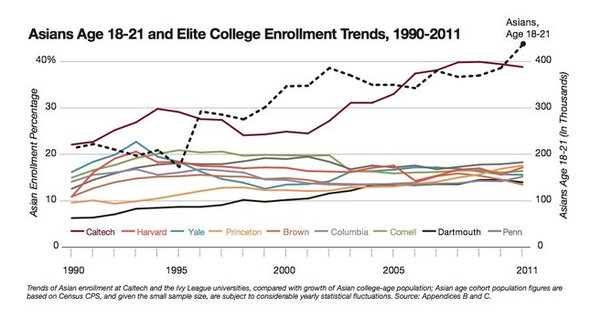
Last week, I posted a surprising finding with regard to the evidence — or lack thereof — of an anti-Asian American cap quota at Harvard. Spurred by the infamous New York Times infographic shown above, I asked whether Harvard’s published freshman enrollment data supported the popular assumption reinforced by the above graph: that Harvard’s Asian American population was stuck at approximately 20%, and had not increased despite increases in Asian American overall population size.
It turns out that when you do the math, this popular preconception turns out to be false: in actuality, when you crunch the numbers with regard to changing applicant pool and falling admission rate, you find that Harvard’s admitted Asian American student population has increased between 2000-2014 at almost exactly the same pace as our national population growth. In other words, admission data simply do not support the conclusion that Harvard’s Asian American student population has been artificially capped to resist the last decade’s increases in Asian American overall population size.
This is a problematic finding for Asian American opponents of affirmative action, because the belief that Harvard exercises an anti-Asian cap quota is one of the primary reasons they cite to argue that affirmative action is unconstitutional, and violates Fourteenth Amendment protections for Asian American students.
Another major argument that Asian American opponents of affirmative action cite is that Asian American students are being admitted into Harvard at a lower admission rate than non-Asian American students because we are overrepresented in the applicant pool.
Sounds like another testable hypothesis, albeit a harder one to really get at since the numbers aren’t published by Havard or any other private academic institution. Still, I asked myself today, is this also something we can crunch the numbers on?
What we’re really asking is whether there’s evidence that more than 20% of Harvard’s 34,295 applicants — or 6,859 applicants — are Asian American?
Edward Blum’s Students For Fair Admissions lawsuit against Havard cites an unpublished study by Richard Sander, who says that based on College Board data 27.3% of high school students who sent their scores to the top three Ivy League schools (presumably Harvard, Yale and Princeton) were Asian American. This, Blum calculates, indicates that Harvard receives over 9,000 Asian American applicants every year; he further argues that this is evidence that Asian Americans are being admitted at lower rates than applicants of other races.
While this might be pretty compelling evidence for a lower admission rate for Asian American applicants to Harvard vs. non-Asian Americans, there is some concern regarding the data. First of all, Sander is reporting the numbers of students who send their SAT scores to Ivies, not those who send complete applications. Indeed, high school students are given four free score reports to send to schools at the time of SAT registration, before or within 9 days of taking the test and before they receive their scores. Students are encouraged to use up all four free score reports, even if they don’t have four schools in mind, and based on a prediction of how they might perform on the SATs.
Thus, the College Board metric of SAT score report demographics is heavily biased by the inclusion of score reports that are being sent to both “safety” and “reach” schools, and further will include scores sent to schools without subsequent completion of an application (which might happen for any number of legitimate reasons). Further, Asian American representation among score reports to the top three Ivies would be artificially high if Asian American students are more likely to concentrate their “reach” schools around the same choices whereas non-Asian American students distribute their “reach” school choices more broadly. And, there’s evidence to support this interpretation of the data: Jeff Yang speaks about the potent “Harvard” name recognition effect among first generation East Asian American parents (and by extension, their college-aged children) that we could easily hypothesize would lead an unexpectedly high number of Asian American kids with an extra score report slot to fill to semi-arbitrarily send it to Harvard or another top Ivy, whether they plan on actually applying to Harvard or not.
Our second cause for concern with regard to this statistic is that it comes from an unpublished paper by Mismatch Theory author Richard Sander, who has been repeatedly criticized by his scientific peers for shoddy and disingenuous scientific analysis. While the fact that Sander authored the work is not, per se, reason to dismiss the finding, the scientific community’s repeated concerns for Sander’s previous publication history demand a peer-review accounting for the conclusions published in the working paper Blum cites; yet, this source is neither peer-reviewed nor publicly accessible for additional consideration regarding the validity of its methodology, so at the very least must be considered with a grain of salt.
Given these concerns with Sander’s numbers, I decided to do a back-of-the-envelope calculation based on other available data to see if I could get a sense of how many Asian American applicants might be applying to Harvard in any given year, and my broad guesstimates are interesting to contemplate.
Here’s a breakdown of the math: the New York Times infographic included as a header of this post indicates that there are approximately 400,000 Asian Americans aged 18-21 in the United States; that means that there are 100,000 Asian American 18-year-olds applying to college in any given year. But, not all of these students are interested in applying to Harvard: in fact, studies show that only about 20% of Asian American students enroll in 4-year private undergraduate institutions; most, instead choose to attend two-year or four-year public colleges or universities. So, that means that approximately 20,000 Asian American high school students nation-wide will be applying to a private college or university every year.
How many of these students are going to apply to Harvard? Richard Sander would have us believe that based on College Board numbers, (34,295 x 27%) 9,362, or nearly half of all Asian American high school seniors eyeing a four-year degree at a private institution, are submitting a competitive application to Harvard. While possible, it’s not likely. Again, it’s quite possible this number is inflated by how the system encourages students to submit their scores to “reach” schools, and doesn’t include an assessment of how many students are actually completing an application to that “reach” school once they receive their scores back.
In addition, most Asian Americans aren’t living in states where applications to Harvard are either typical or often successful: 40% of Harvard’s incoming freshmen hail from the Northeast or mid-Atlantic states. Yet, only 16% — 9% from New York, 4.5% from New Jersey, and 3% from Virginia — live in this region. On the other hand, 32% of Asian American applicants are graduating out of a California high school, and therefore are most likely to want to stay on the West Coast; related to this point, only 17% of Harvard’s incoming freshman call a West Coast state home. Asian American applicant geography is a significant complicating factor that Richard Sander and Edward Blum rarely take into account in their calculations. In addition, there are several other reasons that might make a student interested in a bachelor’s degree from a private 4-year institution might choose not to apply to Harvard.
So, let’s make a more realistic estimate that 30% to 35% of these 20,000 Asian American students who are interested in a 4-year private undergraduate education are actually deciding to apply to Harvard and actually complete an application, even if they live in California, Washington or some other West Coast state. That comes out to approximately 6,000 to 7,000 Asian American completed applications every year to Harvard.
By the way, what number of Asian American applicants should we expect if Harvard’s 409 incoming Asian American freshmen were admitted at the same 5.9% rate as all other students in 2014? 6,932, or ~20% of 2014’s total applicant pool.
While none of this is direct evidence for how many Asian Americans apply to Harvard every year, or proves Richard Sander (or Edward Blum) is wrong in arguing that this number is 27.3% (or 9,632), it certainly provides some context to the numbers being thrown around. These back-of-the-envelope calculations suggest that Sander and Blum’s numbers may be artificially high based on the fudge factor related to Sander’s use of SAT score report patterns as a proxy for completed applications. They further show that to believe that Asian American applicants to Harvard are being admitted at a rate lower than 5.9%, we must also believe that nearly half (or more) of all Asian American applicants to private universities annually are both competitive to Harvard, and have set their sights on that school regardless of family income, geography or academic interests.
Again, that’s not an impossible thing to believe. But, it’s certainly a little improbable, absent any direct data.
Meanwhile, temper your estimates to a far more realistic one-third, and you arrive at an applicant number that reflects an Asian American Harvard admission rate of about 6%, almost exactly at parity with non-Asian American Harvard applicants.

