Here’s the % of voters participating in MSNBC exit polling that were Asian American, by state
|
APIA Demographics |
|||
| % Pop. | Estimated # Registered Voters (55% of APIA) | % APIA Voters in 2012(% of Total Voters) | |
| National (popular) | 5.6 | 9,526,471 | |
| Virginia | 5.8 | 258,282 | 3 |
| Nevada | 7.7 | 115,332 | 4 |
| Colorado | 2.9 | 81,613 | 2 |
| Florida | 2.4 | 251,560 | 1 |
| Iowa | 1.9 | 32,001 | 0 |
| New Hampshire | 2.3 | 16,675 | 1 |
| North Carolina | 2.3 | 122,153 | 1 |
| Ohio | 1.7 | 107,945 | 3 |
| Wisconsin | 2.4 | 75,395 | 1 |
| California | 13.6 | 2,819,355 | 12 |
| New York | 7.8 | 835,057 | 2 |
| New Jersey | 8.7 | 422,092 | 3 |
Note: I’m noticing that this post is being widely shared, which makes me concerned that this table will be taken out of context. A note on where these numbers came from. I’ve listed all the swing states from the 2012 Election, as well as three states (California, New York and New Jersey) where the Asian American population exceeds the national average. The percentage of Asian Americans in each state (and nationally) were obtained from the 2010 U.S. Census. The estimate of registered voters is a rough estimate — it was obtained by determining the size (in numbers) of the Asian American population in each state from the U.S. Census. Then, I calculated the estimate of registered APIA voters by using the rough estimates that 55% of Asian Americans are registered to vote nationally and making the assumption that this reflects state-by-state voter registration. It is a rough estimate based on a pretty general assumption, and should not be construed as hard data. That being said, the numbers turned out to give a pretty good ballpark when considered in post-returns voter numbers and typical voter turnout rates. APIA voter percentages in the righthand column are transposed from MSNBC exit polls administered in each state.
For a discussion of Asian American voters in the 2012 Election, please see this post: How the Asian American electorate shaped Election Night 2012. This table served as some of the raw data that led to that post.
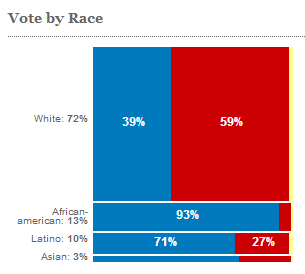
Update: Here’s CNN’s exit polling of all voters by race and how we voted (the number breakdown is 73% to 26%):


