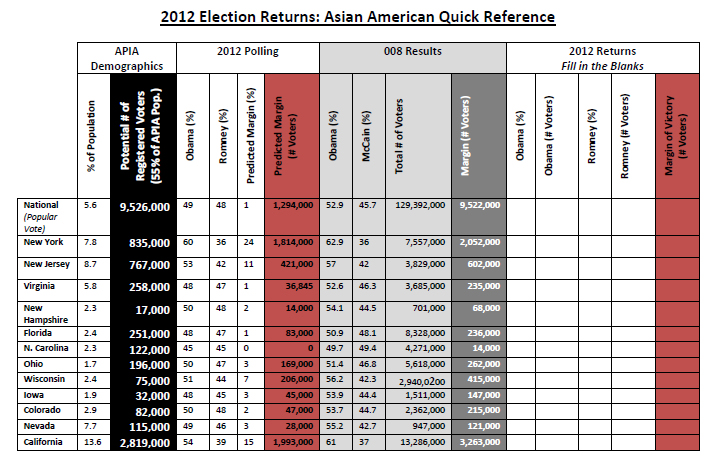
Having a 2012 Election Returns party? I made the following quick reference table which I hope might contextualize the returns, and help identify states wherein Asian American voters might influence the results. You can also download it as a .pdf if you have a burning desire to print it out and fill it in!

It was hard to identify how many APIA registered voters there are, but some reports suggest that approximately 55% of Asian Americans are registered to vote nationally; I figured this was a good (conservative) estimate for state-wide Asian American voter registration, so I used this number as a way to calculate the potential number of registered voters in each state.
The 2012 predicted margin of victory is calculated based on the most recent polls (most of the numbers obtained from CNN’s “Poll of Polls” — mostly just for convenience’s sake since CNN aggregates their polls in one place), multiplied against the total number of voters that turned out in the 2008 election. Since 2008 had record high voter turnout, if the polls hold true, than the margin of victory in terms of actual number of voters may actually be smaller.
All 2008 numbers were obtained from Wikipedia, and Asian American demographic information were obtained from the U.S. Census.
Of course, this table will only be useful in identifying states wherein the Asian American electorate may have been influential — our actual influence will depend entirely on Asian American voter turnout.
Either way, I will be live-Tweeting the 2012 returns on my Twitter account (@reappropriate) starting at 7pm EST. Please join me!
Updated: New version includes New York and New Jersey.
